Hi Guys,
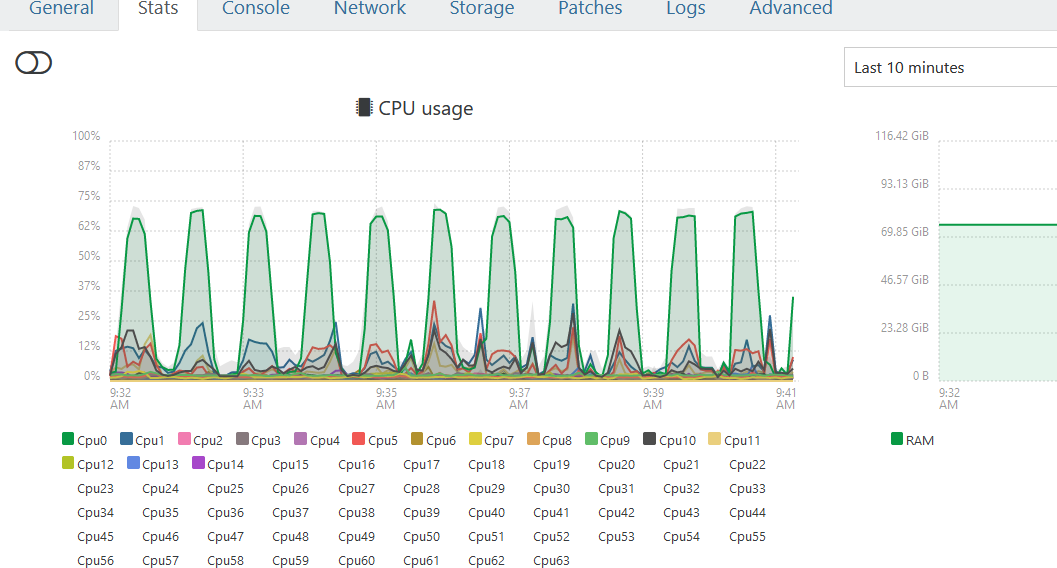
I’m trying to set-up alerts in XO’s perf-alert pluggin based on CPU usage of my hosts. I’m looking at taking based readings from the stats tab for each host to determine an average. However, I’m getting contradictory readings. If I select the “last 10 mins” filter, it shows that one vcore is running just under 75%
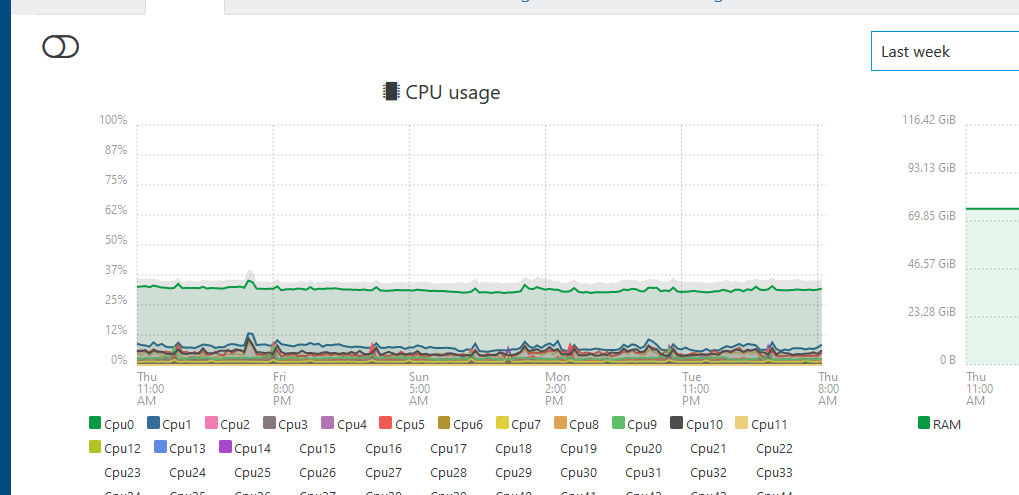
However, if i do this over “the last week” if shows different results.
Perhaps I’m not understanding this stats page clearly enough. Don’t know if I should set my threshold at 85% or 50%
Any comments welcome.
IM
It’s not contradictory. It’s just a different time interval, with different average/mean.
A very short explanation: on the last 10 minutes, you can see CPU spiking to 60% for roughly half of the time. If you do quick maths, 60% on half of the time is (in average) 30% of all the time.
Remember: you are seeing an average, and more you unzoom in time, more they’ll be “averaged”.
1 Like
Ah, it’s an average over time. I understand… Thanks for the clarification.
So this spike realtime would then trigger an alert if then set at >70%. So I’ll need to put a bit more thought into defining what thresholds need to be set as max / min.
Appreciate your help.
1 Like
You are welcome  Averages are both awesome and tricky at the same time. We can probably consider them as “OK in average”
1 Like