Afternoon All;
So, network telemetry, ie data from your network infrastructure recording health and consumptive metrics. Things like interface utilization, interface errors, interface drops, link health (like fiber tx and rx light levels). Also application layer tests measuring basic application latency.
In my experience I’ve located two tools which I’ve found invaluable, both FOSS. Smokeping for Application layer monitoring and Observium for NMS.
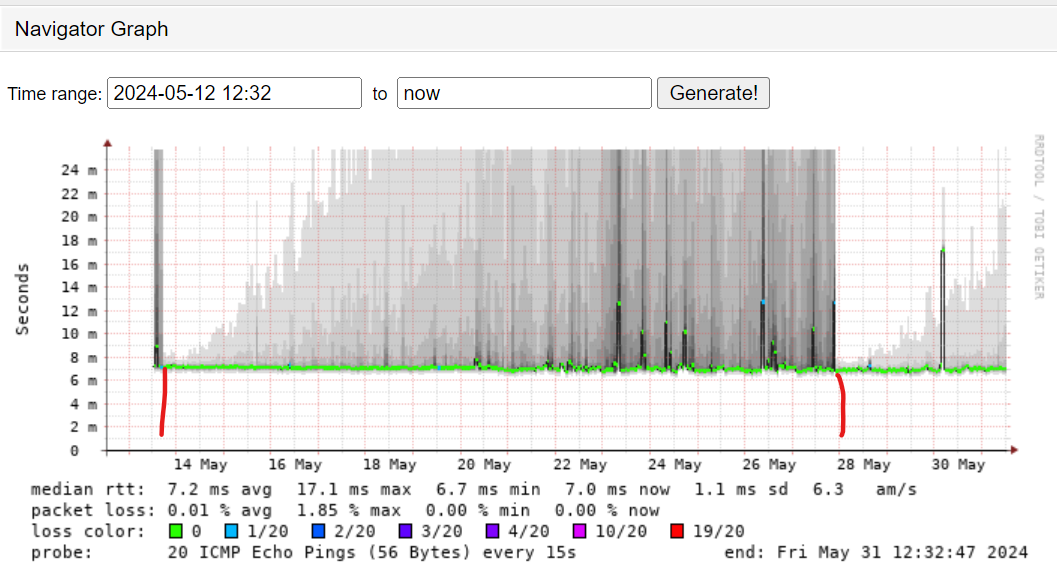
Smokeping. What a great tool You can setup a TON of various tests but I’ve found DNS, HTTPS and PING tests to large cloud providers to be a great Canary in teh Coal mine as to the health of my network (at least from my SP system to WAN to cloud) Just recently my home was behaving poorly. While things worked it was very clunky. Zoom sessions were taking longer than usual to start. Initial webpage loads were also horrible/all over the place. Smokeping tests showed crazy latency and dropped packets. Gateway reboot fixed it. But 12 days later its back and I had the data to show it. Now ATT can review these graphs and data in my trouble ticket to replace my fiber gateway.
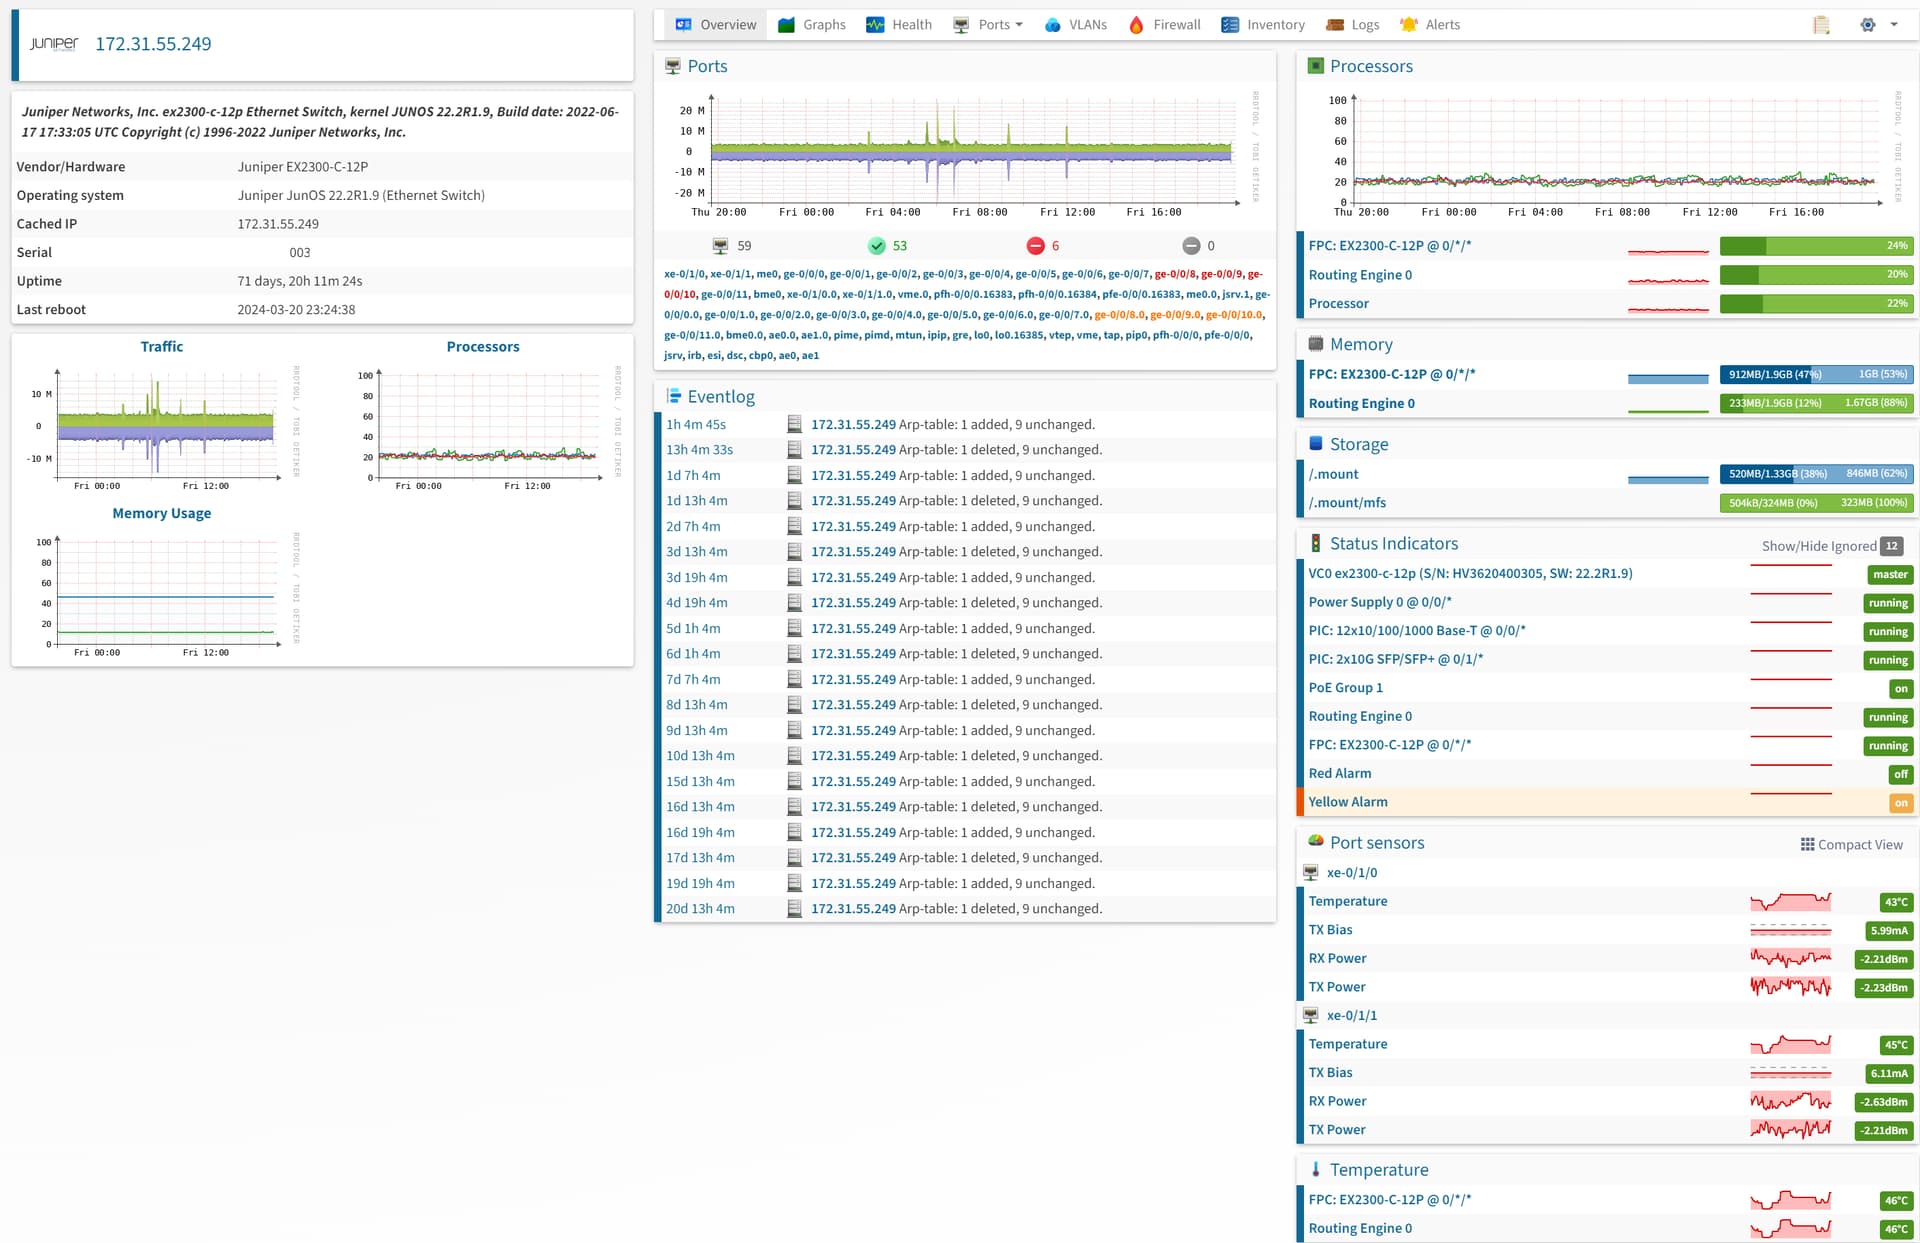
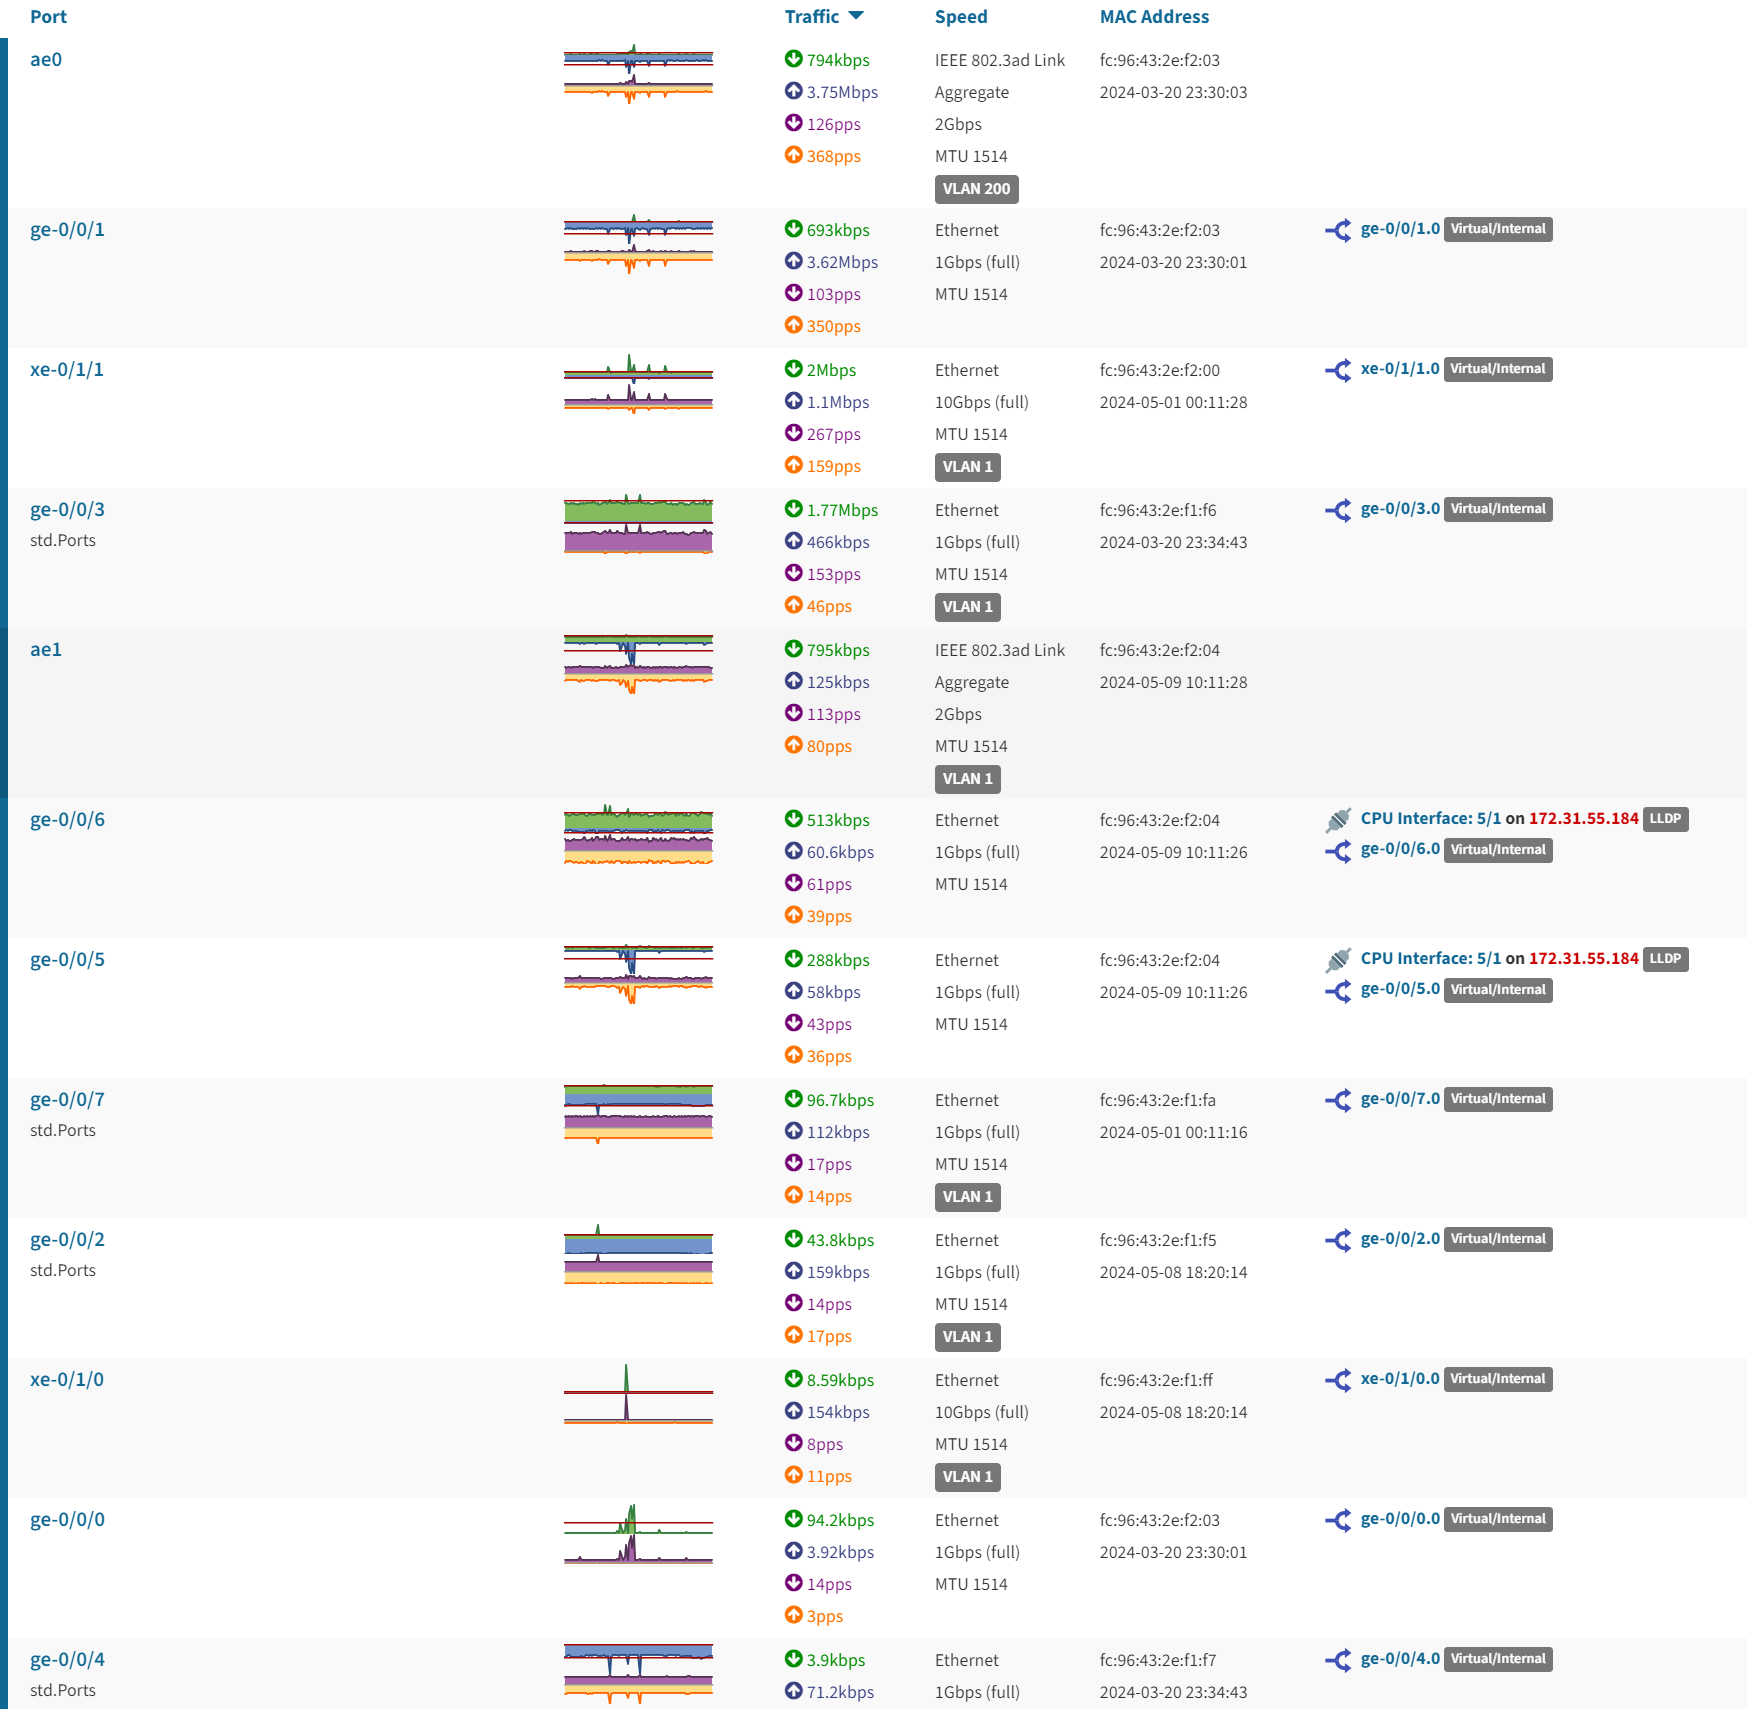
Observium. Less for home more for work. In one environment, they had zero NMS. No visibility at all. Stood this up and spent the next 4 weeks RMA TONS of power supplies (cisco catalyst) which had failed but no one knew. Also found more than a few transceivers showing low light levels and interface discards/drops. Was a mix of bad transceivers, fibers in need of cleaning, VLAN pruning and lastly some MTU mismatches. In one month had that whole company network hitting on all 8 cylinders.
Also these are free tools for anyone ![]()
Those are my fav’s but what about y’all, what software have I not played with that I should
Smokeping. See where the Gateway reboot occurs?
Observium looking at a Juniper ex-2200.